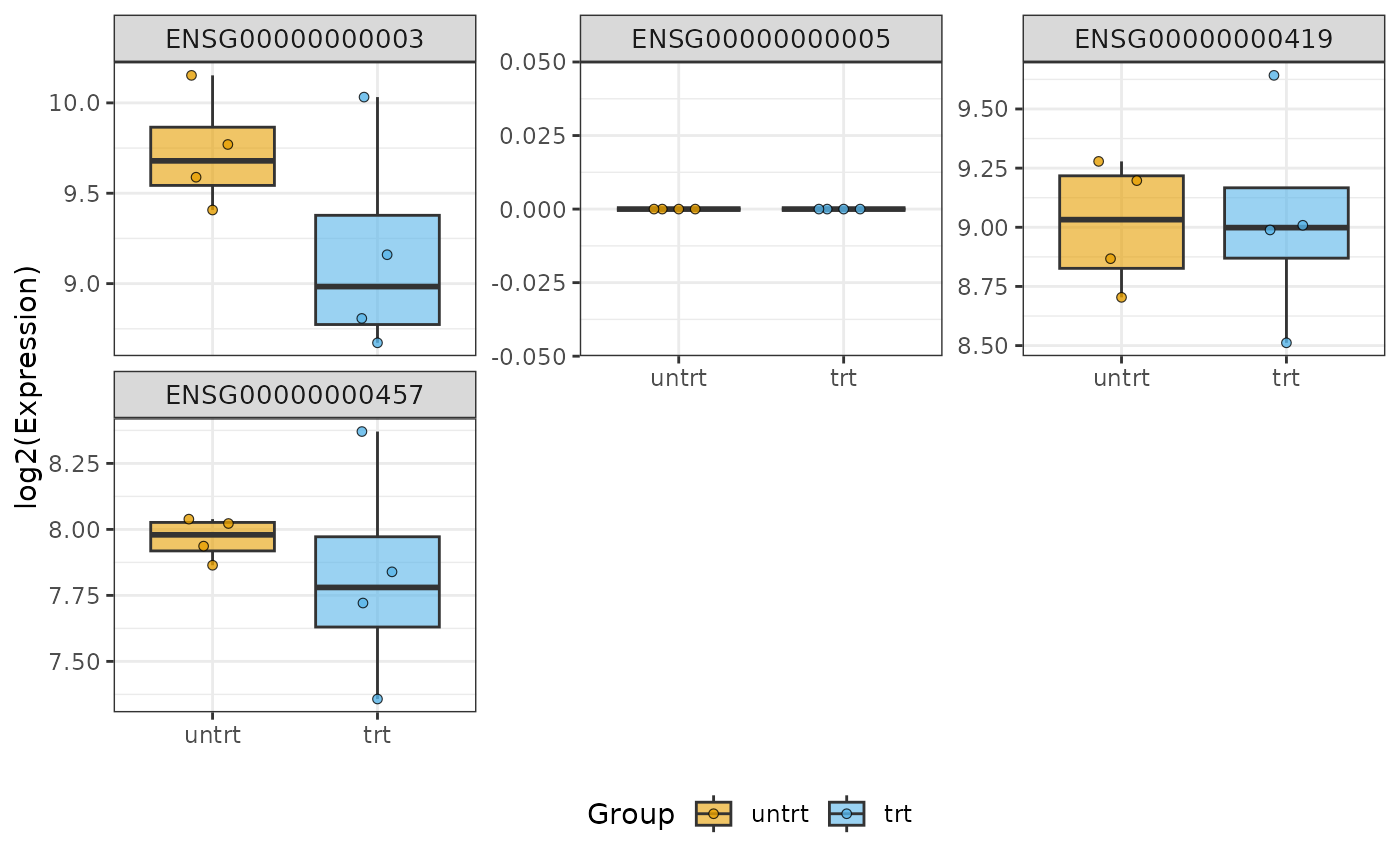
Make a faceted boxplot of the top differential genes in a contrast
Source:R/topgeneboxplot.R
static_topgene_boxplots.RdDraws one boxplot facet per gene, samples grouped by condition, with an
optional beeswarm overlay of individual points. This function only
renders: gene ranking, significance filtering and q values are computed
upstream by the caller (e.g. the contrasts module).
Usage
static_topgene_boxplots(
  assay,
  groupby,
  genes,
  annotations = NULL,
  labels = NULL,
  beeswarm = TRUE,
  ncol = NULL,
  palette = NULL,
  palette_name = COLORBLIND_PALETTE_NAME,
  expressiontype = "expression",
  base_size = 11,
  should_transform = NULL
)
Arguments
- assay
Numeric matrix, genes (rows) by samples (columns)
- groupby
Vector of group labels, one per column of
assay- genes
Character vector of row names of
assayto facet on, in the order facets should appear. Also used to look up values inassay, so must match its row names even whenlabelsis supplied.- annotations
Optional named character vector keyed by the values in
genes, rendered as a per-facet annotation (e.g. a q value string)- labels
Optional named character vector keyed by the values in
genes, used as the facet title in place of the raw gene identifier (e.g. a gene symbol wheregenesholds Ensembl IDs). Genes missing fromlabelsfall back to their raw identifier.genesitself still drives the lookup intoassayand the matching ofannotations.- beeswarm
Overlay individual points using
geom_quasirandom?- ncol
Number of facet columns. Defaults to
min(3, length(genes))- palette
Palette of colours, one for each unique value of
groupby- palette_name
Valid R color palette name
- expressiontype
Expression type for use in y axis label
- base_size
Passed to ggplot's
theme()- should_transform
A boolean indicating if the log2 transformation should be applied. If TRUE, log2 transformation is applied unconditionally. If FALSE, no transformation is applied. If NULL, a conditional transformation based on threshold is applied.