
Synopsis
Shinyngs is an R package designed to facilitate downstream analysis of RNA-seq and similar expression data with various exploratory plots and data mining tools. It is unrelated to the recently published Shiny Transcritome Analysis Resource Tool (START), though it was probably developed at the same time as that work.
Full documentation and function reference: https://pinin4fjords.github.io/shinyngs/
Examples
Data structure
A companion R package, zhangneurons, contains an example dataset to illustrate the features of Shinyngs, as well as the code required to produce it.
Running application
A Shinyngs example is running at https://pinin4fjords.shinyapps.io/shinyngs_example/ and contains a subset of the example data (due to limited resources on shinyapps.io).
Rationale
Shinyngs differs to START and other similar applications (see also Degust), in that no effort is made to provide analysis capabilities. The envisaged process is:
- RNA-seq data is analysed, producing a set of matrices, and p/q values generated for a given set of comparisons.
- Matrix and comparison data is loaded into the modified SummarizedExperiment structure provided by Shinyngs, and serialised. This is easily automated.
- Serialised object used as input to autmoatically produce the Shiny app using Shinyngs.
There are a great many experimental designs and analysis methods, and in building Shinyngs I’ve taken the view that analysis is best left to the analyst. The envisaged use case is that of a bioinformatician attempting to convey results of analysis to non-experts.
ShinyNGS provides a number of capabilities you may not find in other applications:
- Simple selection of gene sets by name/ annotation to modify the plots and tables shown.
- Progressive filters for differential analysis: “Show me all genes differential in these contrasts but NOT in these other contrasts”
- Large variety of visualisations: row-wise clustering, UpSet-style intersection plots, gene set enrichment barcode plots etc.
- An interactive igv.js-powered gene model view in the gene page, showing exon/transcript structure alongside expression, when feature metadata includes genomic coordinates and an Ensembl species is configured (see
--ensembl_speciesbelow). - A “Share view” button that captures the current selections in the page URL, so a configured view can be bookmarked or shared with a link.
Screenshots
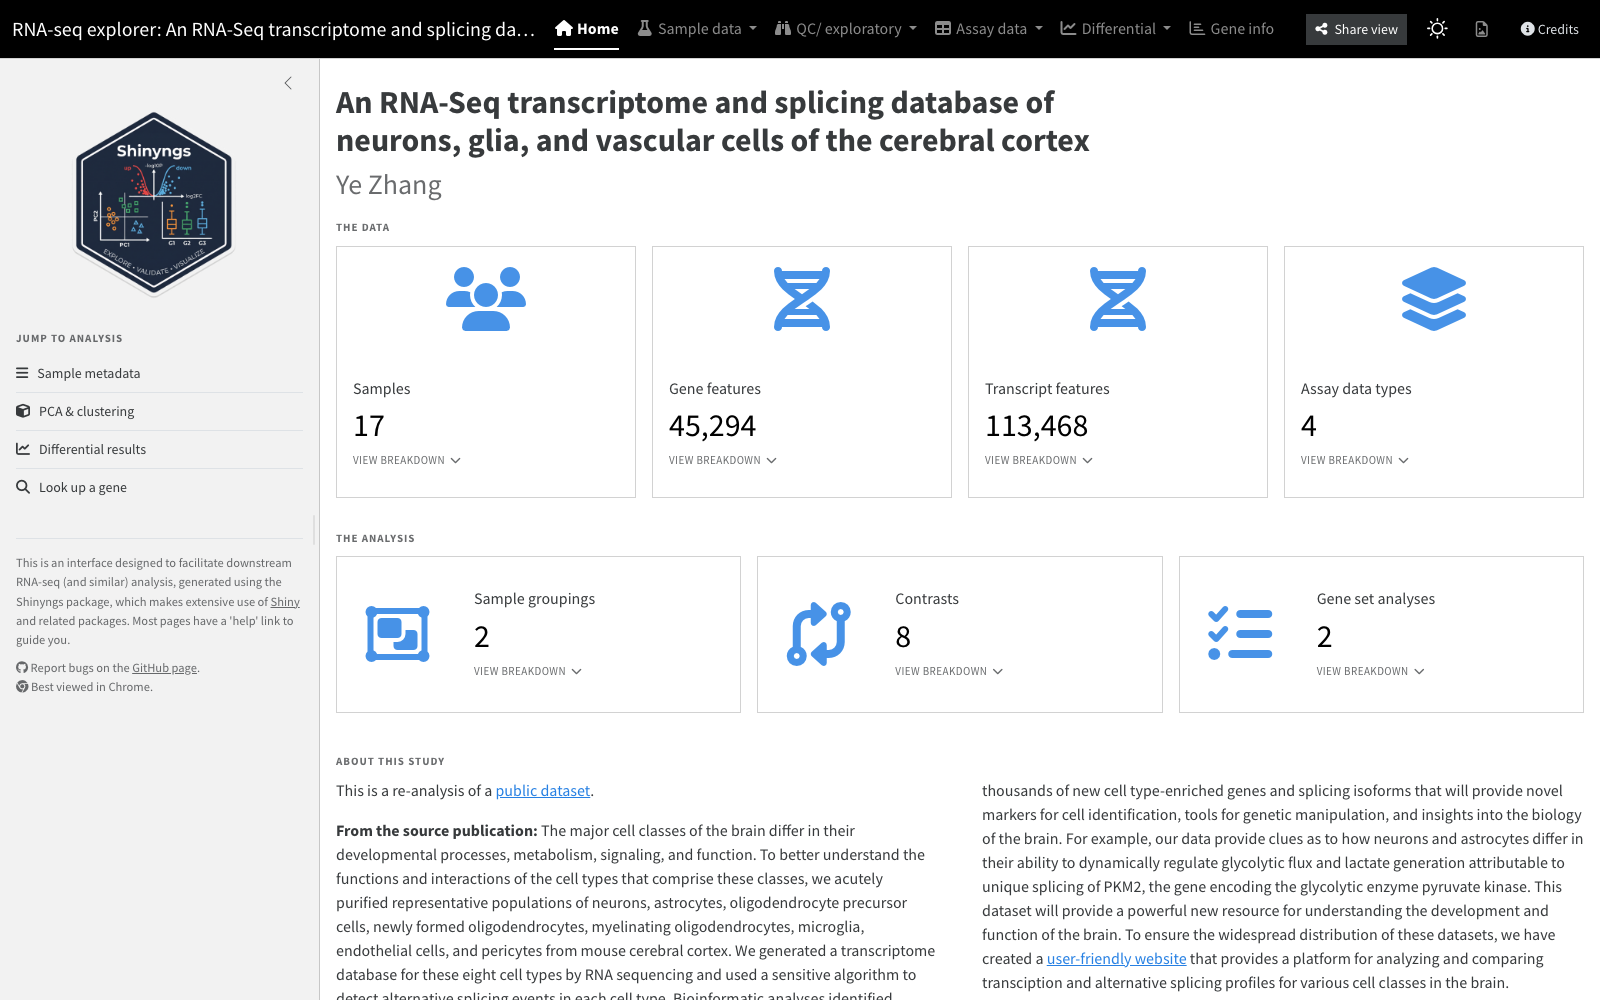
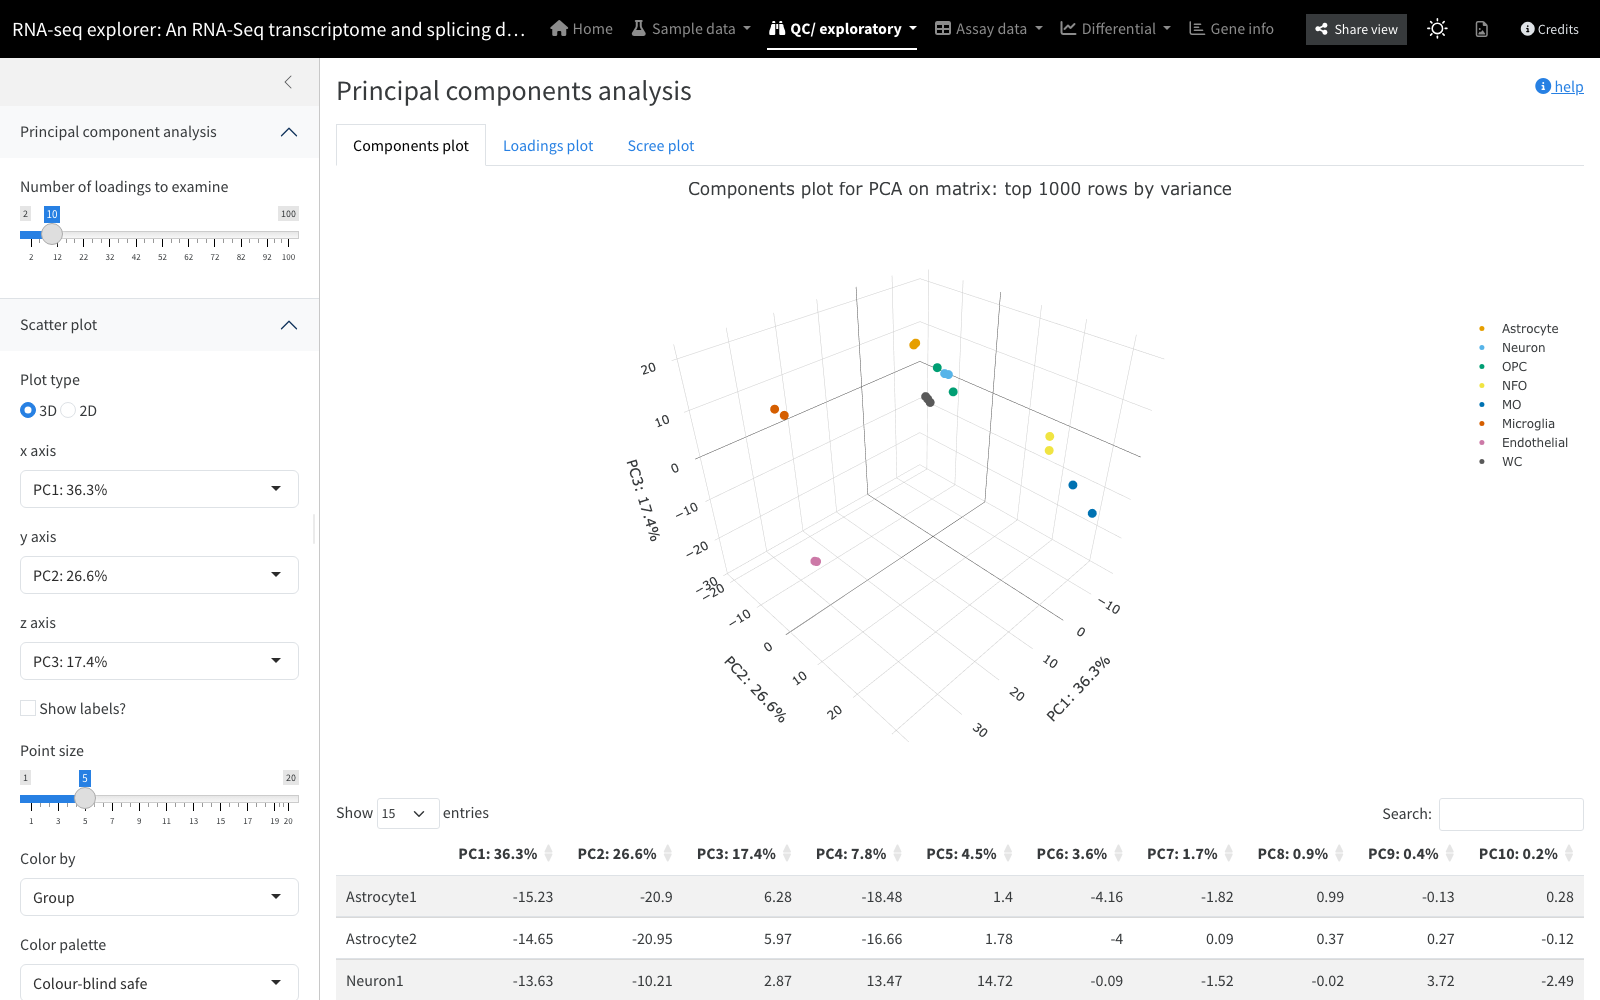
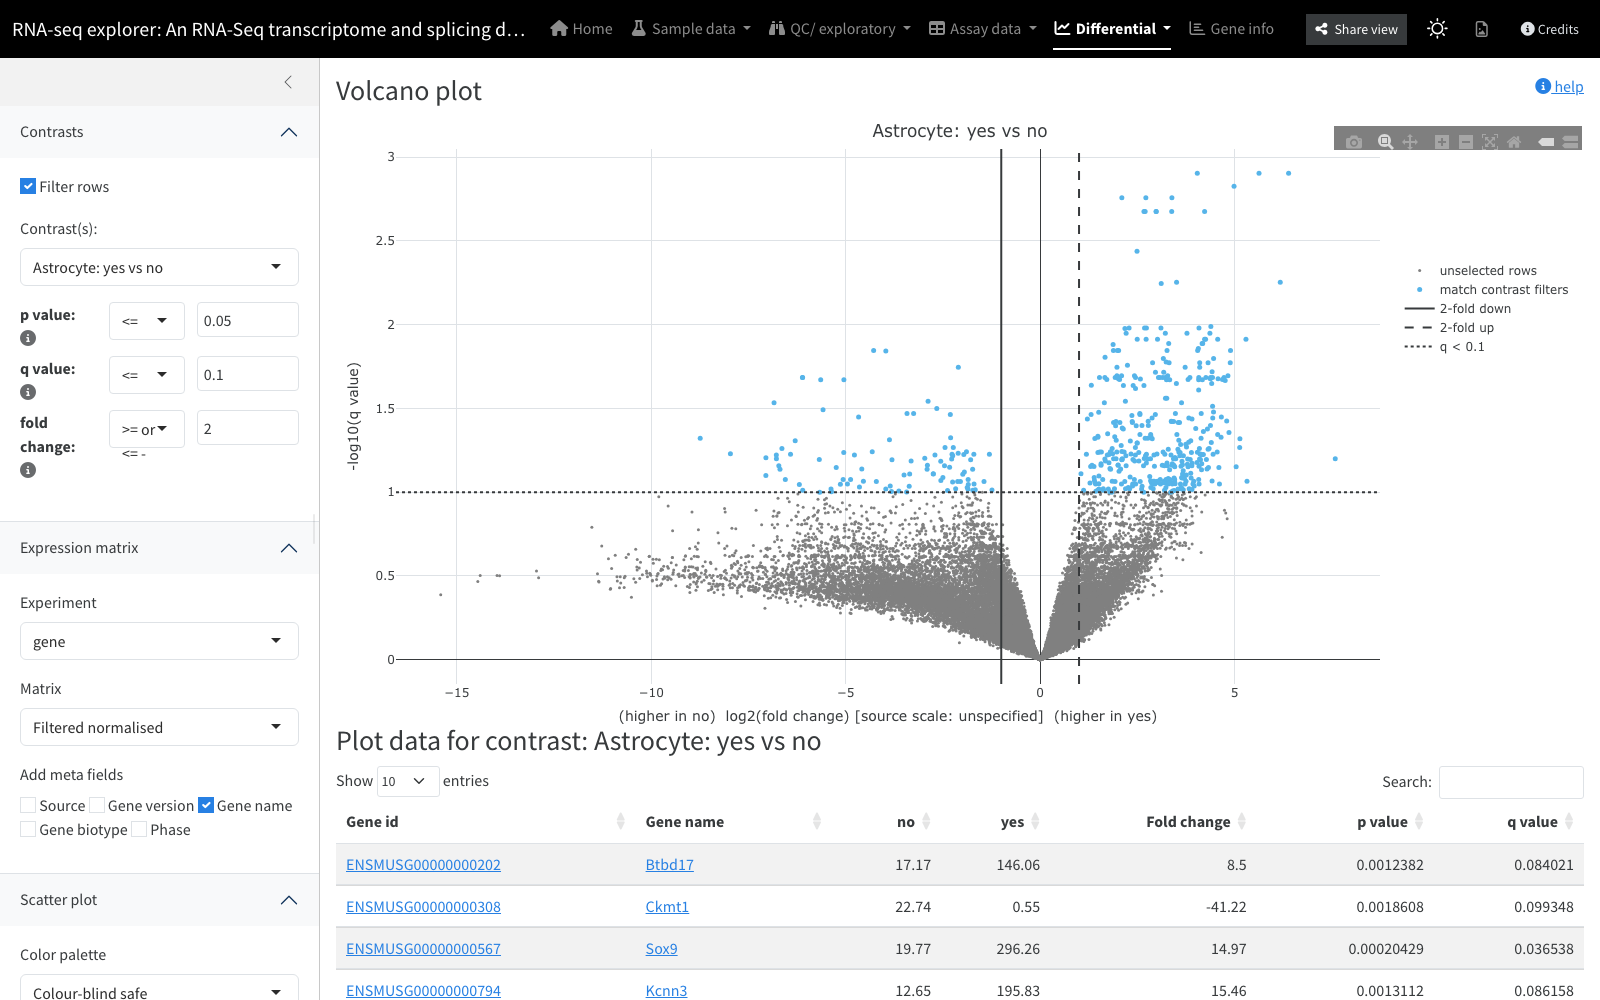
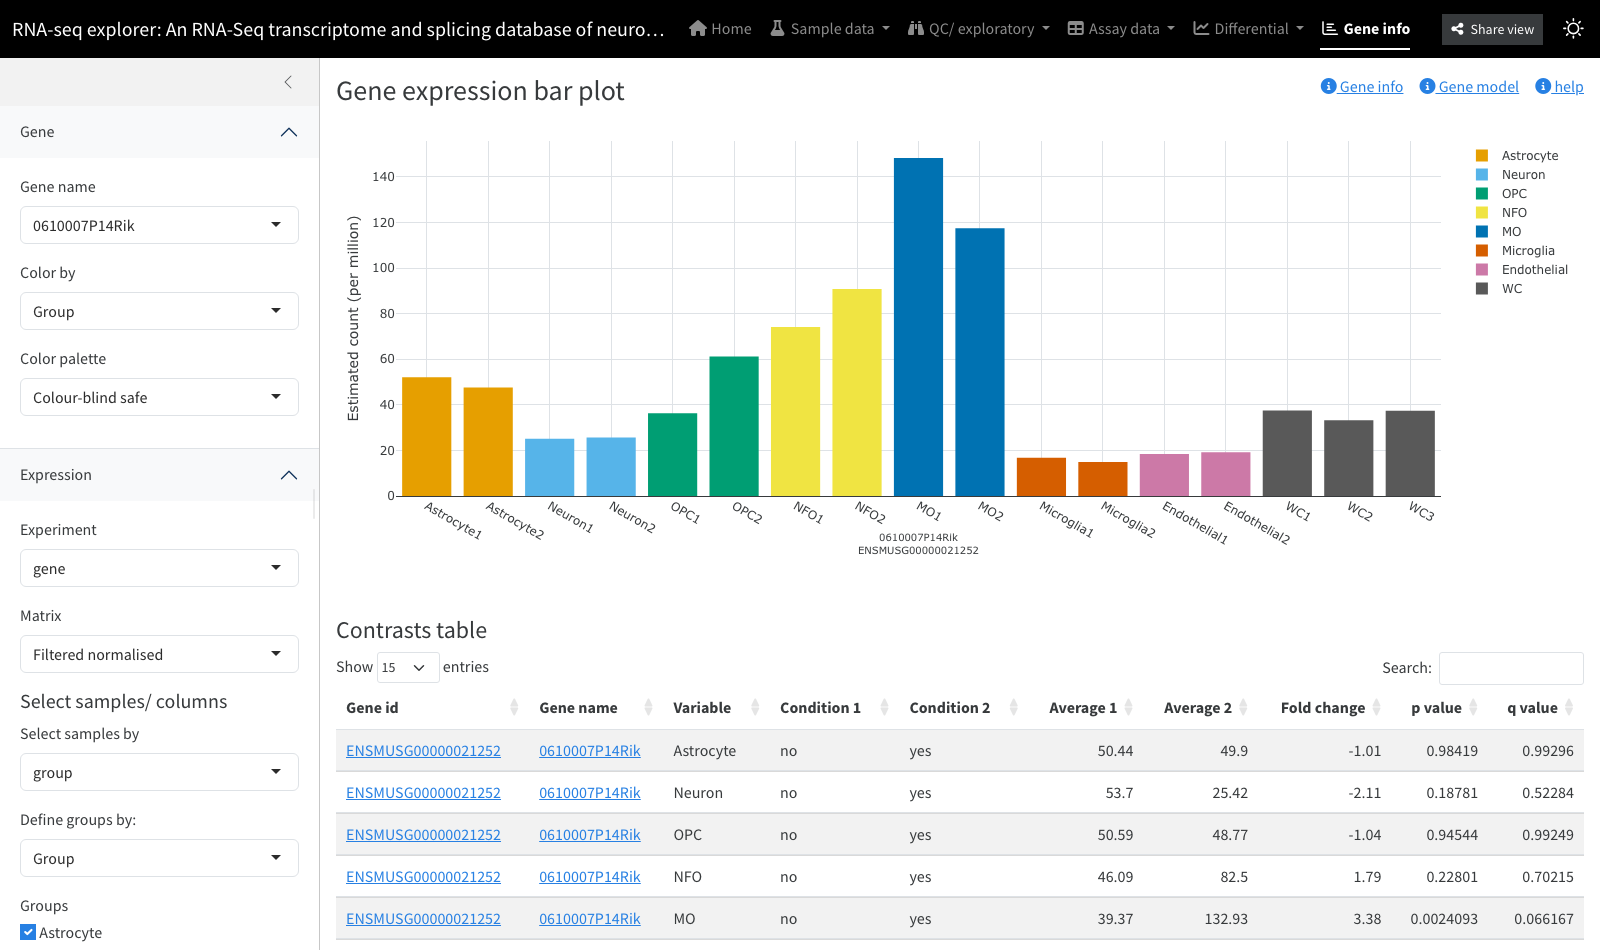
See the module and panel catalogue for a screenshot of every panel the app can show.
Objectives
- Allow rapid exploration of data output more or less straight from RNA-seq piplelines etc.
- Where more parameters are provided, extend the exploratory tools available - e.g. for differential expression.
Features
- A variety of single and multiple-panel Shiny applications- currently heatmap, pca, boxplot, dendrogram, gene-wise barplot, various tables and an RNA-seq app combining all of these.
- Leveraging of libraries such as DataTables and Plotly for rich interactivity.
- Takes input in an extension of the commonly used
SummarizedExperimentformat, calledExploratorySummarizedExperiment - Interface kept simple where possible, with complexity automatically added where required:
- Input field clutter reduced with the use of collapses from shinyBS (when installed).
- If a list of
ExploratorySummarizedExperiments is supplied (useful in situiations where the features are different beween matrices - e.g. from transcript- and gene- level analyses), a selection field will be provided. - If a selected experiment contains more than one assay, a selector will again be provided.
- For me: leveraging of Shiny modules. This makes re-using complex UI components much easier, and maintaining application code is orders of magnitude simpler as a result.
Modularisation
Shinyngs is built on Shiny ‘modules’- most of which are in single files in the package code. As a consequence code is highly re-usable. Documentation forthcoming, but take a look at how the selectmatrix module is called by the PCA plots, boxplots etc.
Installation
Prerequisites
shinyngs relies heavily on SummarizedExperiment. Formerly found in the GenomicRanges package, it now has its own package on Bioconductor: http://bioconductor.org/packages/release/bioc/html/SummarizedExperiment.html. This requires a recent version of R.
Graphical enhancements are provided by shinyBS and shinyjs
Conda
shinyngs is available as a Conda packge in Bioconda, as always it’s recommended to use a clean environment. With the Bioconda channel appropriately configured you can just do:
(though I always recommend the mamba command in place of conda).
Docker container
Through the magic of the Bioconda and Biocontainers teams there is also a Docker image available.
Development version from GitHub
The Conda package above is the recommended, supported way to install shinyngs. To track development instead, install directly from GitHub with devtools:
devtools::install_github('pinin4fjords/shinyngs')Example
An example ExploratorySummarizedExperimentList based on the Zhang et al study of neurons and glia (http://www.jneurosci.org/content/34/36/11929.long) is available in a separate package, and this can be used to demonstrate available features.
Install the package like:
library(devtools)
install_github('pinin4fjords/zhangneurons')
… and load and use the data like:
library(shinyngs)
library(zhangneurons)
data("zhangneurons")

app <- prepare_app("rnaseq", zhangneurons)
shiny::shinyApp(app$ui, app$server)
The function eselist_from_yaml() is provided to help build your own objects given a config file.
Command-line interfaces
App creation
Shiny apps can be created directly from file complements:
make_app_from_files.R \
    --assay_files raw.tsv,normalised_counts.tsv \
    --sample_metadata samplesheet.csv \
    --feature_metadata gene_meta.tsv \
    --contrast_file contrasts.csv \
    --differential_results treatment-saline-drug.deseq2.results.tsv \
    --output_dir app \
    --contrast_stats_assay 2 \
    --fold_change_scale log2
(This script can be found under exec).
This is designed to take a regular file complement of
- Expression matrices
- Metadata (samples and features)
- Contrasts (which sample groups to compare)
- Differential resutls (e.g. from DESeq2) containing P values and fold changes
.. and produce an app.R. Gene set enrichment results (GSEA, ROAST, or other tools via a custom column mapping) can also be wired in via --enrichment_gene_sets and --enrichment_filename_template - see “Building an app from files with enrichment results” in the vignette for a worked example.
If --feature_metadata includes chromosome_name, start_position and end_position columns, passing --ensembl_species (e.g. hsapiens, mmusculus) enables the gene model view described above.
You can start the resulting app locally, by running the app.R resulting from the above command.
See make_app_from_files.R --help for more info.
shinyapps.io deployment
The following specified to make_app_from_files.R in addition to the above will trigger a deployment to shinyapps.io where the app can be viewed:
You must derive your token and secret from your shinyapps.io account and set them in the environment variables SHINYAPPS_TOKEN and SHINYAPPS_SECRET, respectively.
This is currently dependent on shinyngs having been installed via devtools, which doesn’t happen in the Conda install, but I’m trying to address that.
Static plot generation
I’ve found it useful to reuse some of the plotting components in shinyngs to produce non-Shiny plot outputs for use in static reporting.
Exploratory analysis
A generic complement of explortory plots can be generated like:
exploratory_plots.R \
    --assay_files salmon.merged.gene_counts.tsv,normalised_counts.tsv,variance_stabilised_counts.tsv \
    --assay_names raw,normalised,variance_stabilised \
    --sample_metadata samplesheet.csv \
    --contrast_variable treatment \
    --outdir plots \
    --feature_metadata gene_meta.tsv
See exploratory_plots.R --help for more info.
Differential analysis
Differential analysis plots, currently just volcano plots, can be generated with differential_plots.R. See exploratory_plots.R --help for more info.
Validation
shinyngs has some good validation when building objects, to make sure that matrices are consistent with sample and feature annotations, and that the specified contrasts make sense. Accessing that logic by itself can be useful when writing FOM (feature/ observation matrix) workflows, so that is available separately like:
validate_fom_components.R \
    --sample_metadata=testdata/samplesheet.csv \
    --assay_files=testdata/SRP254919.salmon.merged.gene_counts.top1000cov.tsv \
    --contrasts_file testdata/contrasts.csv \
    --output_directory output
If --output_directory is specified, results are re-written (in a consistent format, TSV by default) the specified location.
This script will error if there are inconsistencies between sample sheets, feature sets, matrices, and contrast specifications.
Documentation
Technical information can be accessed via the package documentation:
?shinyngsUser-oriented guides live on the package website, including getting started, the data model, building an app from files, the command-line reference, a module catalogue, reusing components inside and outside Shiny, theming and shareable views, and a developer guide.
The getting-started guide is also accessible via the vignette command:
vignette('shinyngs')Credits
Shinyngs combines a number of other open-source packages to do its work. Deployed apps also carry a “Credits” link in the navbar crediting these directly, but for reference:
- Shiny (Winston Chang, Joe Cheng, JJ Allaire, Carson Sievert et al., Posit Software) and bslib (Carson Sievert, Joe Cheng, Garrick Aden-Buie) - the application framework and Bootstrap 5 theming.
- DT (Yihui Xie, Joe Cheng, Xianying Tan, Garrick Aden-Buie), wrapping the DataTables jQuery plugin (SpryMedia Ltd) - interactive tables.
- plotly (Carson Sievert, Chris Parmer, Toby Hocking, Scott Chamberlain, Karthik Ram, Marianne Corvellec, Pedro Despouy), wrapping plotly.js (Plotly Technologies Inc.) - interactive plots.
- heatmaply (Tal Galili, Alan O’Callaghan) - interactive heatmaps.
- ggplot2 (Hadley Wickham et al.) and ggdendro (Andrie de Vries) - static plotting.
- igvShiny (Paul Shannon, Arkadiusz Gladki, Karolina Ścigocka), wrapping the Integrative Genomics Viewer (igv.js, Broad Institute) - the gene model browser.
- SummarizedExperiment (Martin Morgan, Valerie Obenchain, Jim Hester, Hervé Pagès), limma (Gordon Smyth et al.) and DEXSeq (Simon Anders, Alejandro Reyes) from Bioconductor.
The full dependency list, with versions, is in DESCRIPTION.