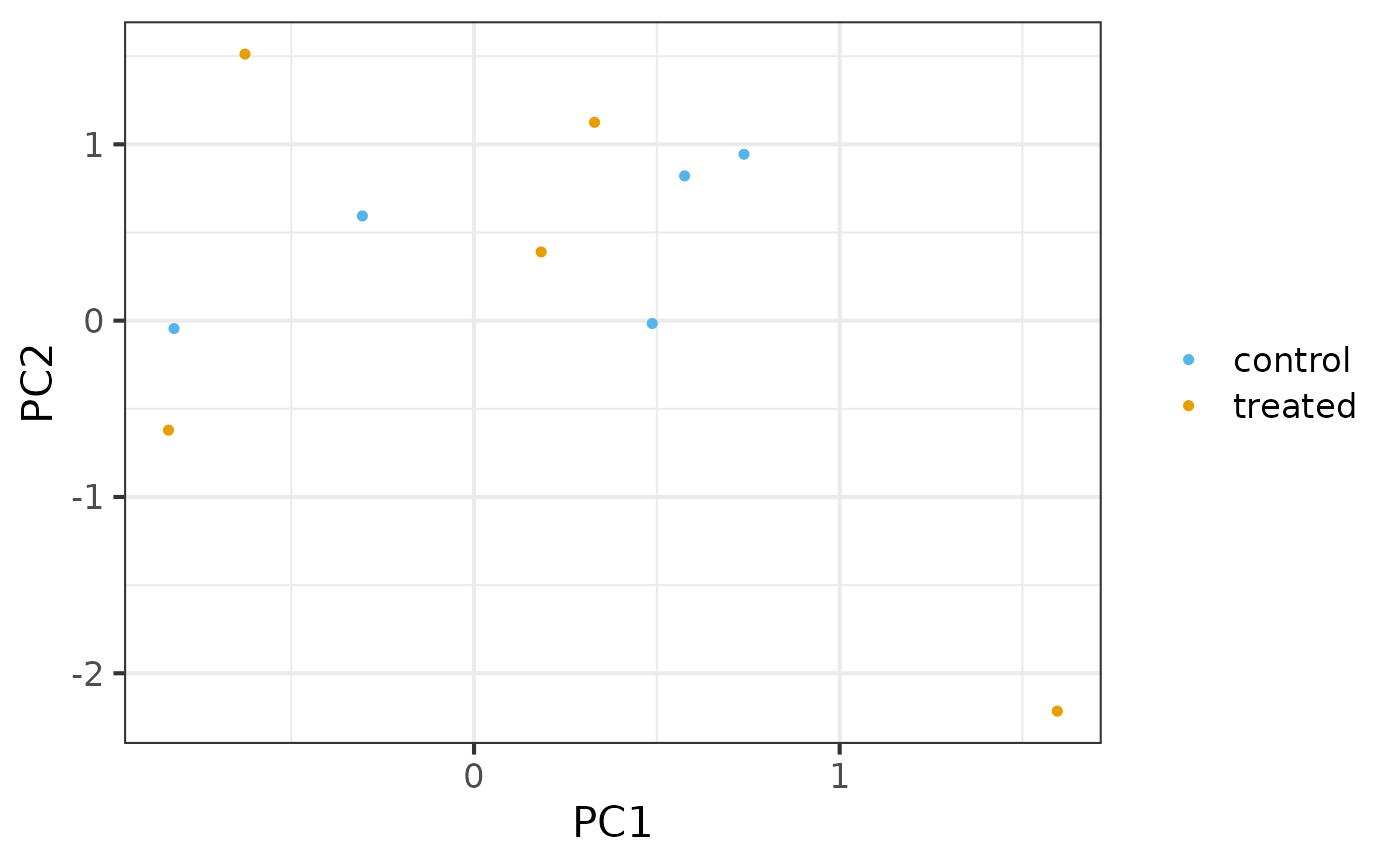
These are not used in the shinyngs UI, but are provided here to be fairly consistent with the plotly-driven display, and provide a static alternative for external users.
Usage
static_scatterplot(
  x,
  y,
  z = NULL,
  colorby = NULL,
  plot_type = "scatter",
  title = "",
  legend_title = NULL,
  xlab = "x",
  ylab = "y",
  zlab = "z",
  palette = NULL,
  point_size = 1,
  labels = colorby,
  show_labels = FALSE,
  hline_thresholds = NULL,
  vline_thresholds = NULL,
  showlegend = TRUE,
  palette_name = COLORBLIND_PALETTE_NAME
)
Arguments
- x
X coordinates
- y
Y coordinates
- z
Optional Z coordinates
- colorby
String vector or factor specifying value groups
- plot_type
Plot type: 'scatter' (ggplot) or 'scatter3d' (scatterplot3d)
- title
Plot title
- legend_title
Legend title
- xlab
X label
- ylab
Y label
- zlab
Z label
- palette
Color palette correct for the number of groups in 'colorby'
- point_size
Main point size
- labels
Point labels
- show_labels
Permanently show labels for labelled points
- hline_thresholds
Named list of horizontal lines with y coordinates
- vline_thresholds
Named list of vertical lines x coordinates
- showlegend
Boolean: show a legend?
- palette_name
Valid R color palette name