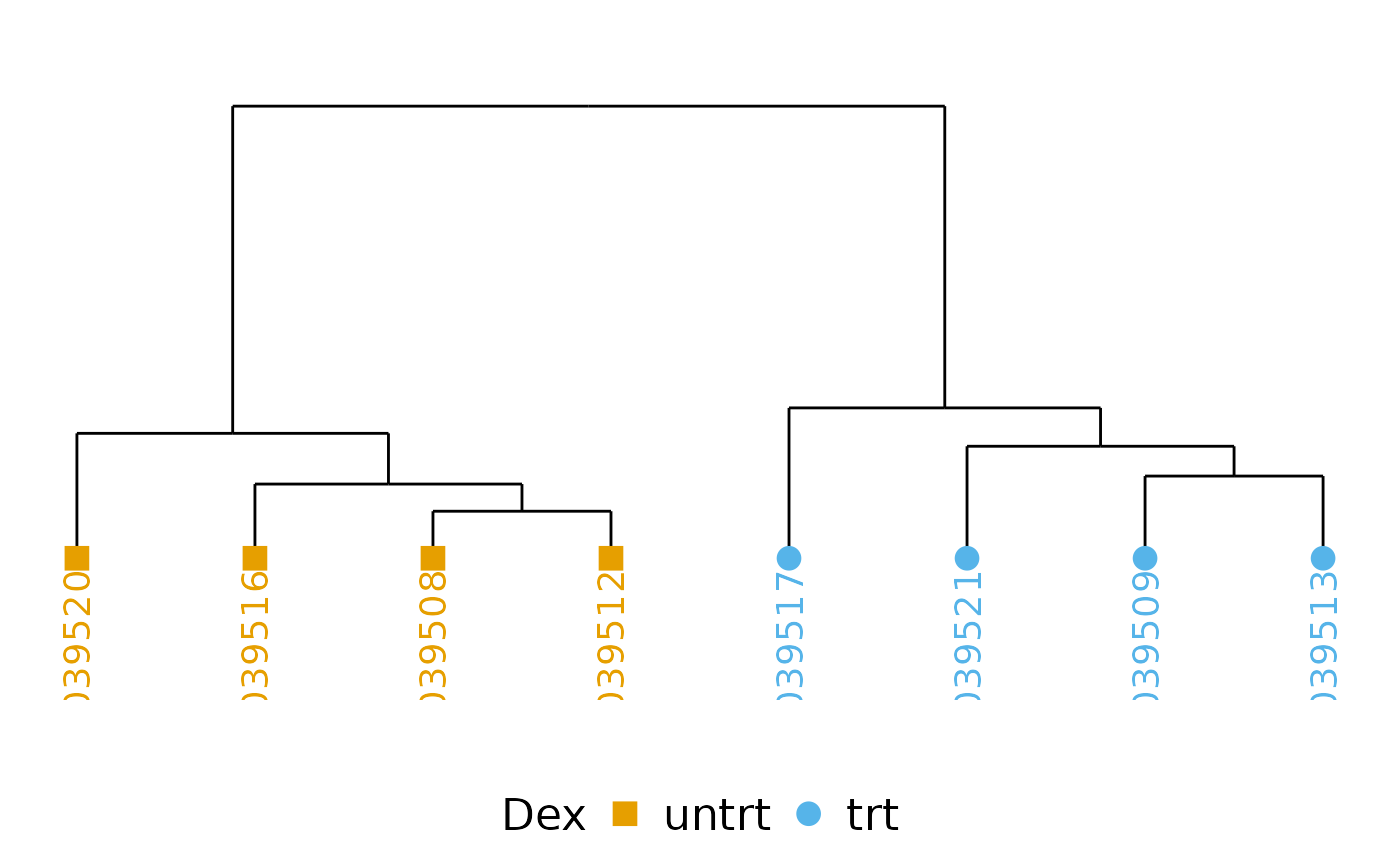
Make a clustering dendrogram with coloring by experimental variable
Source:R/dendro.R
clustering_dendrogram.RdA simple function using ggdendro to make a sample dendrogram
Usage
clustering_dendrogram(
  plotmatrix,
  experiment,
  colorby = NULL,
  cor_method = "pearson",
  cluster_method = "ward.D",
  plot_title = "",
  labelspace = 0.2,
  palette = NULL,
  palette_name = COLORBLIND_PALETTE_NAME
)
Arguments
- plotmatrix
Expression/ other data matrix
- experiment
Annotation for the columns of plotmatrix
- colorby
Column name in
experimentspecifying how boxes should be colored- cor_method
Correlation method, passed to cor() (default: pearson).
- cluster_method
Clustering method, passed to hclust() (default: ward.D).
- plot_title
Plot title
- labelspace
Vertical fraction of plot to be used for labels (default: 0.2).
- palette
Palette of colors, one for each unique value derived from
colorby.- palette_name
Valid R color palette name
Examples
# Make a dendrogram with the data in airway
require(airway)
data(airway, package = "airway")
clustering_dendrogram(assays(airway)[[1]], data.frame(colData(airway)), colorby = "dex")
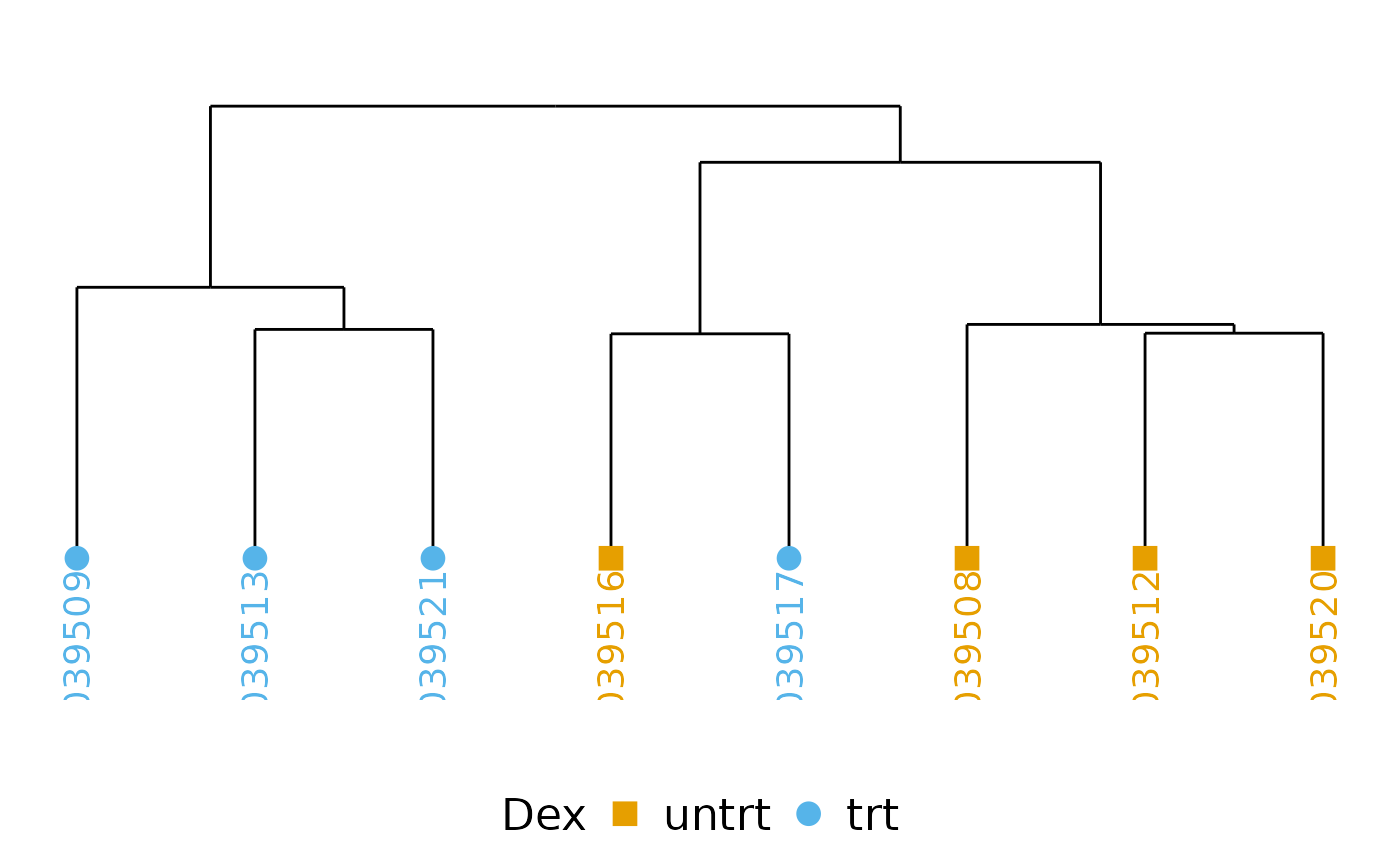 # Do the same, but only usig the 1000 most variant rows and see how the
# clustering improves.
mymatrix <- assays(airway)[[1]]
mymatrix <- mymatrix[order(apply(mymatrix, 1, var), decreasing = TRUE)[1:1000], ]
clustering_dendrogram(mymatrix, data.frame(colData(airway)), colorby = "dex")
# Do the same, but only usig the 1000 most variant rows and see how the
# clustering improves.
mymatrix <- assays(airway)[[1]]
mymatrix <- mymatrix[order(apply(mymatrix, 1, var), decreasing = TRUE)[1:1000], ]
clustering_dendrogram(mymatrix, data.frame(colData(airway)), colorby = "dex")